Change the colour of the Grasshopper canvas

To change the colour of the Grasshopper canvas, Johannes Braumann very helpfully provided a C# script. However, the script is now out of date with recent builds of Grasshopper, having been published in 2010. Below is an updated, working version.

This script helped me change the colour of the Grasshopper canvas to be white – which has saved me a lot of time in updating images in posts like this.

The component looks like this:

Grasshopper change canvas colour component

Do-it-yourself C# script

Paste the script into a C# component. Take care to set input names and types to match the parameters below. This code is lightly modified from Braumann’s script.

  private void RunScript(bool switcher, Color canvas_back, Color canvas_grid, ref object A)
  {
    if (switcher == true)
    {
      Grasshopper.GUI.Canvas.GH_Skin.canvas_grid = canvas_grid;
      Grasshopper.GUI.Canvas.GH_Skin.canvas_back = canvas_back; 
      Grasshopper.GUI.Canvas.GH_Skin.canvas_edge = Color.FromArgb(255, 0, 0, 0); 
      Grasshopper.GUI.Canvas.GH_Skin.canvas_shade = Color.FromArgb(80, 0, 0, 0); 
    }
    else
    {
      //DEFAULTS
      Grasshopper.GUI.Canvas.GH_Skin.canvas_grid = Color.FromArgb(30, 0, 0, 0);
      Grasshopper.GUI.Canvas.GH_Skin.canvas_back = Color.FromArgb(255, 212, 208, 200); 
      Grasshopper.GUI.Canvas.GH_Skin.canvas_edge = Color.FromArgb(255, 0, 0, 0); 
      Grasshopper.GUI.Canvas.GH_Skin.canvas_shade = Color.FromArgb(80, 0, 0, 0);
    }
  }

Download a ready-made component

If you would rather not play about with the C# component, you can just open this Grasshopper file instead.

Open and run Grasshopper from a batch file

How to automatically open Rhino and run a Grasshopper file using a batch file.

A batch file is a file that allows Windows to run a list of commands automatically. They are simple text files with file extension .bat that you can easily write yourself. This post is a good tutorial on how to make a batch file.

Batch files were used in the Pollination project in Grasshopper to automate Grasshopper tasks between multiple computers. Andrew Heumann explained here how to write the batch file to start Rhino and run a Grasshopper file.

What to write in the Grasshopper batch file

Copy this into a text document, and change the fields to your own file locations. Save the file, and change the extension from .txt to .bat.

@ECHO OFF
cd **PATH TO DIRECTORY CONTAINING GH FILE**
"**PATH TO RHINO.EXE**" /nosplash /runscript="-grasshopper editor load document open **GRASSHOPPER FILE NAME** _enter" "**PATH TO ASSOCIATED RHINO FILE**"

For example, I have a Rhino and a GH file on my desktop, respectively called random.gh and random2.3dm.

@ECHO OFF
cd C:\Users\jrams\Desktop
"C:\Program Files\Rhinoceros 5 (64-bit)\System\rhino.exe" /nosplash /runscript="-grasshopper editor load document open C:\Users\jrams\Desktop\random.gh _enter" "C:\Users\jrams\Desktop\random2.3dm"

Now you can just double-click on the batch file you have made. Rhino should now open with your Grasshopper file.

Seeing an error with the characters ╗┐?

The ECHO OFF command should stop the command prompt from being visible. Sometimes, you might get an error like this. This error stops the first line in your batch file from being executed properly, in this case disabling the ECHO OFF command.

batch file BOM error

Long story short, your text file’s encoding is incompatible with the command prompt. To fix, in Notepad, save with ANSI encoding. Or in Sublime, go to File then Save With Encoding. Choose UTF-8 (NOT UTF-8 with BOM).

Grasshopper: Where is Grasshopper.dll and GH_IO.dll?

When developing Grasshopper components, we need to make reference to two Grasshopper Dlls: Grasshopper.dll and GH_IO.dll. These provide the GH_Component class, which custom components inherit from, as well as providing other useful Grasshopper functions.

Grasshopper.dll and GH_IO.dll

The exact location depends upon your particular Rhino installation. On my computer, I found them buried within the AppData folder at:

C:\Users\James\AppData\Roaming\McNeel\Rhinoceros\5.0\Plug-ins\Grasshopper {...}\0.9.76.0

Within this folder, I found a large collection of files, including Grasshopper.dll and GH_IO.dll.

A similar path may exist on your computer. If you can’t find anything like it on yours, you can look up the folder through Rhino: (from David Rutten)

  1. Start Rhino
  2. Run the _PluginManager command
  3. Locate Grasshopper in the list of plugins
  4. Open the properties for the Grasshopper plugin
  5. At the bottom of the Properties window there’s a ‘File name’ entry
  6. This points to GrasshopperPlugin.rhp, which is sitting next to Grasshopper.dll

You may need to widen the window to see the full path.

Grasshopper DLL path

Semi-structured interviews: How many interviews are enough?

Semi-structured interviews are a useful tool for gathering qualitative information. They provide more rigour than an entirely unstructured interview, allowing the interviewer to attempt to answer a number of predefined questions and allowing common themes between interviews to be established. They are more flexible and free-flowing than questionnaires or structured interviews, allowing interviewees to diverge from an interview plan when it might provide useful information that the interviewer hadn’t anticipated asking about.

Semi-structured interviews take time

Semi-structured interviews are time-consuming to perform. Each interview is performed manually, and is usually then transcribed, analysed and codified mostly by hand. Yet, if we are using semi-structured interviews to establish patterns across a population, we must have a sufficient sample size to give us confidence in any conclusions we arrive at.

So, we want a lot of interviews as this will reinforce our findings. But we want to minimise the number of interviews so we aren’t spending weeks or months gathering and analysing data. How do we decide where the sweet spot lies?

How do people choose the right number of interviews?

The answer to this is often based on gut feeling and experience, as well as the conditions within which the research is taking place (such as number of interviewees available, time available and so on). Guides rarely provide quantified guidance. Journal articles often fail to robustly justify the number of interviews that were performed, usually citing practical limits instead.

One approach that can be taken is that of reaching a point of ‘saturation’ (Glaser & Strauss, 1967). Saturation is the point at which, after a number of interviews has been performed, it is unlikely that performing further interviews will reveal new information that hasn’t already emerged in a previous interview. Optimising the number of interviews can therefore be thought of as seeking this saturation point.

It is surprising that, given the presence of a basic knowledge of statistics in most researchers in engineering, once a social sciences technique is used in an engineering paper, the use of rigorous mathematical techniques to underpin the statistical worthiness of a series of interviews seems to be forgotten about. This deficiency has been addressed in a recent paper from Galvin (2015).

A more robust approach

Galvin attempts to answer the question of how many interviews should be performed. He is critical on the use of experience and precedence, and instead uses a range of established statistical techniques to offer guidance to the reader.

He uses the assumption that outcomes are boolean. In semi-structured interviews, this normally manifests itself as whether a theme is or isn’t present in a particular interview. This kind of data usually produces outcomes structured like “7 of the 10 interviewees mentioned saving money on bills as important when choosing to insulate their home” for example.

Without sampling the entire population, we can never be truly certain that our sample is entirely representative. But as the sample size increases, we can become increasingly confident. If (and this is a big if!) our sample is randomly selected, we can use binomial logic to say how confident we are that the results from our sample are representative of the whole population.

Why we need to take a statistical approach

This all sounds very simple, but as Galvin found, it is quite remarkable how many recent published papers exist that attempt to draw out conclusions generalised across a large population derived from tiny sample sizes, without any attempt to show that a questionably small sample size can still be relied upon to deliver a conclusive answer. Small sample sizes are to be expected with semi-structured interviews, but the time-consuming nature of this technique isn’t by itself enough justification.

What we need is a way of justifying the number of interviews that are required for our study that is robust, and that allows conclusions to be drawn from results that are statistically significant.

An equation for the number of interviews

Of interest in Galvin’s paper is therefore an equation that calculates an ideal number of interviews, given a desired confidence interval and the expected probability that a theme. The ideal number of interviewees means one that ensures that a theme held by a certain proportion of the population will have been mentioned in at least one interview. This equation to calculate the minimum number of interviews is:

equation number of semi structured interviews

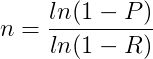
P is the required confidence interval, between 0 and 1. (Galvin took a value of 0.95 throughout the paper, indicating a confidence level of 95%.) R is probability that a theme will emerge in a particular interview (e.g. the likelihood that a particular interviewee will view cost as important when insulating a home).

So, for example, if we are after a confidence level of 95%, and we guess that 70% of people view cost as important in the entire population, then we would need to conduct 3 interviews to be 95% confident that this theme will have emerged in at least one of the interviews.

Of course, the statistical reliability of this method hinges on the accuracy of our guess for R. This is unlikely to stand up to scrutiny. What may be more useful instead is if we flip the equation, and say “given that I will conduct n interviews, themes that are held by at least R% of the population are P% likely to emerge”.

The equation for this is:

semi structured interview equation

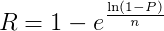
As an example, if we have conducted 10 interviews (n=10) and we will be happy with 95% confidence (P=0.95) then R=0.25, i.e. for 10 interviews, we are 95% confident that at least one person will have mentioned a theme held by at least 25% of the parent population. Or, in other words, if we run the experiment 100 times, each with a random subset of 10 interviewees, then in 95 of these, at least one person will mention a theme that is held by 25% of the parent population.

It is worth mentioning that the value of R is a function not only the proportion of the population who hold a particular theme, but also the interviewer’s skill in extracting this theme from the interviewee. While not a topic that will be dwelled upon here, this highlights the need for the interviewer to prepare and practise thoroughly to make best use of the interviews.

So, in conclusion, we have two equations which tell us in slightly different ways how many interviews we should do. If you can confidently give a lower bound estimate on R, then you can use the first equation to give the minimum number of interviews required. If you can’t estimate R, then you can use the second equation to suggest the maximum level of obscurity that a theme has amongst the population to still be exposed by your collection of interviews.

Can we estimate percentages from our interviews?

The above equation allows us to determine the minimum number of interviews to be reasonably sure that themes of interest will be mentioned in at least one interview. Once all interviews have been completed, we can expect to have a list of themes compiled from the different interviews.

Certainly, some themes will be mentioned by more than one interview. Taking the example above where 7 interviewees of 10 mention cost savings as being important, can we reasonably extrapolate this result to the whole population, and say that about 70% of the population therefore view cost savings as being important?

A basic knowledge of statistics will tell you it’s not as simple as this, and that there is a margin of error as you move from a sample to the entire population. Let’s say, after the first 10, you hypothetically carried on interviewing people until you had interviewed everybody. (In this case, this could be every homeowner in the UK!) You might have found, by the time you’d finished this gargantuan task, that in fact 18 million of 20 million homeowners thought saving money on bills was important – 90%. When you did your first 10, you were just unlucky in finding three people early on who didn’t care about bills enough to mention it.

When we take a sample, there is a probability that we will experience this ‘bad luck’ and find that our percentage from our sample is different from the percentage of the population at large. The likely difference between these percentages is the margin of error. If our sample is truly a random subset of the wider population, then we can make a statistical guess about how large this margin could be.

The trouble with small sample sizes, as is usually the case with semi-structured interviews, is that this margin is usually very large. The equation for this margin is:

wilson's score interval

Wilson’s score interval. Wilson (1904), Newcombe (1998)

p is the proportion of interviewees who mentioned a theme. z is the normal distribution z-value. If we continue using a 95% confidence interval, then z=1.96. n is the number of interviewees.

l1 and l2 are the lower and upper margins of error for p. What this equation tells us is that, if our interview tells us that p% of interviewees mention a theme, then we are 95% sure that, if we were to interview the entire population, that p would eventually converge to somewhere between l1 and l2.

If we run these numbers on a typical semi-structured interview results, where n is usually small, then the difference between l1 and l2 is large. The graph below shows results for n=3 and n=40 for a range of values of p.

margin of error for semi-structured interviews

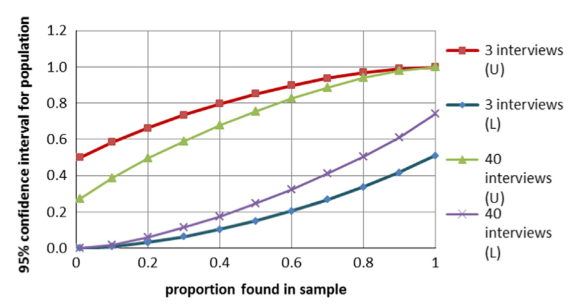
Source: Galvin (2015)

What is clear is that, typically, even for research plans with a fairly large number of interviews, the margin of error is going to be large. Too large, in fact, to be able to draw any meaningful quantified answers. If 16 of 40 interviewees (p=0.4) mention a theme, the proportion in the entire population could reasonably be anywhere between 19% and 67%.

So, the short answer is, no, you can’t usually quantify percentages from your interviews.

But in any case, this isn’t really what semi-structured interviews are for. These interviews will allow you to build a list of themes and opinions that are held by the population. Their nature allows these themes to emerge in a fluid manner in the interviews. If you are looking to quantify the occurrence of these themes, why not run a second round of surveys? Surveys are inherently rigid, but your semi-structured interviews have already allowed you to anticipate the kinds of responses people will be likely to give. And with surveys, you can issue and analyse many more, allowing you to raise that pesky n value.

References

If you found this article useful and would like to reference any information in it, then I recommend you read Galvin’s paper and pick out the information you wish to reference from there.

Galvin, R., 2015. How many interviews are enough? Do qualitative interviews in building energy consumption research produce reliable knowledge? Journal of Building Engineering, 1, pp.2–12.
Glaser, B., Strauss, A., 1967. The Discovery of Grounded Theory: Strategies for Qualitative Research, Aldine Publishing Company, New York.
Newcombe, R., 1998. Two-sided confidence intervals for the single proportion: comparison of seven methods, Stat. Med., 17, pp857–872.
Wilson, E., 1904. The Foundations of Mathematics, Bull. Am. Math. Soc. 11 (2) pp74–93.

Further reading

DiCicco-Bloom, B., Crabtree, B. F, 2006. The qualitative research interview. Medical Education, 40, pp.314-321.

How to get to Kiroro ski resort

Kiroro Ski Resort is one of the best ski resorts in Hokkaido, and it’s easy to see why. Great runs, English-friendly, brilliant snow, and yet it manages to avoid the crowds of the nearby, more popular Niseko.

The resort also has the advantage of being close to Sapporo, making it easy to get to. This guide will give you some of the best ways on how to get to Kiroro ski resort.

Kiroro ski resort Hokkaido, Yoichi run

Directly from the airport

Buses run directly from the airport from December to March, with 6 buses a day in each direction.

Check this page for times, and to book online.

If you want to go by train as much as possible, or there isn’t a suitable bus, then take the train from the airport to Sapporo. Trains are every 15 minutes and cost 1070JPY. Then, to get from Sapporo to Kiroro, read below.

By Hokkaido Access Network bus from Sapporo

Buses run from Sapporo bus station to Kiroro, stopping at various hotels along the way. The buses are well-timed for day trips – they leave Sapporo in the morning, and drive back in the evening. Buses run daily through winter. Check this page for exact times and to book online.

The buses are quite expensive, at 3500JPY each way. I haven’t taken this bus yet so I don’t know what it’s like – if you have, please leave your comments below.

By Chuo Bus from Sapporo or Otaru bus stations

Chuo bus, the main bus company in the Sapporo region, is my preferred way to get to Kiroro. The buses are comfortable, and there was plenty of space when I took it. The buses are actually full-size coaches, and there’s plenty of space for ski equipment.

The buses run both from Sapporo bus station and Otaru bus station, next to their respective train stations. They leave at 08:10 from both bus stations. If you have a choice between the two, I’d recommend making your way to Otaru, as it’s the closer of the two to Kiroro.

It’s possible to just turn up at the bus station and buy a ticket on the day. However, to avoid disappointment, I recommend booking online here. (There’s an English button in the top right.)

However, they have one big disadvantage – the buses only run on holidays and weekends. They run daily over the New Year Period, and Saturdays, Sundays and public holidays. Check the above link for dates. If the Chuo bus is running, I recommend you take this service. If not, you can use the (much more expensive) Hokkaido Access Network from Sapporo otherwise.

Otaru bus station

From Otaru, a ticket costs 930JPY each way, and 1540JPY from Sapporo. Buy a ticket at vending machines at the bus station, or you can use your Kitaca card.

Reservation is supposedly required, though I’ve used the buses without a reservation myself. Call Kiroro Resort General Information on 0135-34-7111 by 6pm the day before to make a reservation.

By Kiroro resort bus from Otaru Chikko station

Unfortunately, as of the 2016-17 season, the free bus from Otaru Chikko station no longer appears to be running 🙁

If the Chuo bus isn’t running when you need it, you could take the resort-run free bus. This bus runs daily from the taxi rank outside Otaru-Chikko station, including weekdays. The bus leaves Otaru-Chikko at 08:30, 10:00, 13:00, 15:05 and 18:25, and the return bus leaves Kiroro at 12:10, 14:15 and 17:30. The bus is free of charge both ways.

However, I only recommend the resort bus on days the Chuo bus isn’t running. Why?

  • The bus is first-come first-served, with no reservation system. The service is popular and there is a realistic chance that you will be left behind.
  • The bus is small and quite uncomfortable. The seats are tiny, with no legroom.

If you do decide to take the resort bus, do arrive at least 15 minutes early and form a queue at the taxi rank. Similarly, on your return, arrive early at the resort hotel (where the bus will drop you off and pick you up from) to be sure of getting a seat.

For more information on times, fares and pickup points, see the company’s website.

By car

Car rental in Japan is not expensive if you book in advance. Driving is quite a feasible way of getting around, and there is plenty of parking at ski resorts.

The main problem is the amount of snow and ice on the road. The Japanese do a good job of clearing their roads, especially in the cities, but the volume of snow that falls means that dangerous road conditions are inevitable, especially outside of the cities on the mountain roads. If you are not used to driving on snow and ice, I wouldn’t make this a time to start.

Truck clearing snow on Japanese road

Another thing to consider is making sure you hire a car that is big enough for your ski equipment! Japanese Kei-cars (the boxy little cars you see everywhere with the yellow reg plates) may be tempting because they’re the cheapest (sometimes less than 4000JPY/day), but make sure you can get everything in it, occupants included, before you drive away.

Suzuki Wagon Japanese Kei car

To book your car, I use ToCoo! to organise car hire. Prices are as good as you’ll find anywhere, and the whole website is in English.

By taxi

Taxi obviously isn’t the cheapest option, but it’s feasible if you have no other way.

The nearest town to Kiroro is Otaru, a 28km drive away. Taxis cost around 600JPY per 1.5km, so expect a charge of around 10000JPY if by the meter. You’ll find taxis waiting outside Otaru station.

Grasshopper: Map a path using C#

The Path Mapper is a component that allows you to map data to different branches. It is also possible to replicate this behaviour entirely in C#.

The following code maps object x to path address 0, 0, 5. See this post for a simple overview on data trees in Grasshopper.

‘DataTree’ is the class made specifically for the C# component to handle data trees. (If you’re programming in Visual Studio, it’s better to use GH_Structure.) We use a different class, GH_Path, as the tool to define the path structure.

C# code

  private void RunScript(object x, object y, ref object A)
  {

    int[] address = {0, 0, 5};
    var pth = new GH_Path(address);
    var tree = new DataTree<object>();

    tree.Add(x, pth);
    A = tree;

  }

Grasshopper example: Glare using Radiance/Honeybee

A simple example of how to set up a glare analysis using Honeybee, an interface for providing Radiance daylight analysis in Grasshopper.

Grasshopper canvas for Honeybee glare analysis

Download


Images

Grasshopper shoebox example for glare analysis

The simple building used for analysis

glare example Grasshopper Radiance

Using EmbryoViz to visualise how a user would perceive daylight and glare inside the building

Grasshopper: automatically create a value list in C#

Another example on how to automatically create a value list in Grasshopper using the C# component.

This file is mostly for personal reference, but there are snippets in here that you may find useful. I designed this component to read a text file containing XML-like data, save the data in a class structure, and then filter the data. The filtering is done by a drop-down list that is automatically added by the component, and is pre-populated with valid options.

Useful code includes:

  • How to create a value list with C# code
  • How to populate the value list
  • How to create and use a DataTree in the C# component

C# code

This code is designed for the C# component in Grasshopper.

private void RunScript(List<string> x, int y, ref object params_, ref object results_)
  {

    var models = new List<Model>();

    //parse input text
    for (int i = 0; i < x.Count; i += (valuecount + 2))
    {
      var model = new Model();
      model.Params = FormatParamString(x[i]); //convert CSV to list of doubles
      for (int j = i + 1; j < i + 4; j++)
      {
        var item = new DictItem();
        FormatModelLine(x[j], out item.Name, out item.Value);
        model.Results.Add(item);
      }
      models.Add(model);
    }
    Component.Message = models.Count.ToString() + " models";

    AnalysisTypes = CalcUniqueAnalyses(models);

    //make dropdown box
    if(Component.Params.Input[1].SourceCount == 0 && Component.Params.Input[0].SourceCount > 0)
    {
      var vallist = new Grasshopper.Kernel.Special.GH_ValueList();
      vallist.CreateAttributes();
      vallist.Name = "Analysis types";
      vallist.NickName = "Analysis:";
      vallist.ListMode = Grasshopper.Kernel.Special.GH_ValueListMode.DropDown;

      int inputcount = this.Component.Params.Input[1].SourceCount;
      vallist.Attributes.Pivot = new PointF((float) this.Component.Attributes.DocObject.Attributes.Bounds.Left - vallist.Attributes.Bounds.Width - 30, (float) this.Component.Params.Input[1].Attributes.Bounds.Y + inputcount * 30);

      vallist.ListItems.Clear();

      for(int i = 0; i < AnalysisTypes.Count; i++)
      {
        vallist.ListItems.Add(new Grasshopper.Kernel.Special.GH_ValueListItem(AnalysisTypes[i], i.ToString()));
      }
      vallist.Description = AnalysisTypes.Count.ToString() + " analyses were found in the SBA file.";

      GrasshopperDocument.AddObject(vallist, false);

      this.Component.Params.Input[1].AddSource(vallist);
      vallist.ExpireSolution(true);
    }

    //we now have our results in a nice classy format. let's convert them to a datatree
    var resultsvals = new DataTree<double>();
    var paramvals = new DataTree<double>();
    string astr = AnalysisTypes[y];

    Component.Params.Output[1].VolatileData.Clear(); //bug fix for when new dropdown is made
    Component.Params.Output[2].VolatileData.Clear(); //bug fix for when new dropdown is made

    for (int i = 0; i < models.Count; i++)
    {
      var pth = new GH_Path(i);
      foreach (var result in models[i].Results)
      {
        if(astr == result.Name)
        {
          resultsvals.Add(result.Value, pth);
          foreach(var param in models[i].Params)
          {
            paramvals.Add(param, pth);
          }
        }
      }
    }
    results_ = resultsvals;
    params_ = paramvals;


  }

  // <Custom additional code> 

  int valuecount = 3;
  List<string> AnalysisTypes = new List<string>();

  public class DictItem
  {
    public DictItem()
    {
    }

    public string Name;
    public double Value;
  }

  public class Model
  {
    public Model()
    {
    }

    public List<double> Params = new List<double>();
    public List<DictItem> Results = new List<DictItem>();

    public List<string> ToListString()
    {
      var rtnlist = new List<string>();
      foreach (var result in Results) rtnlist.Add(result.Name + ", " + result.Value.ToString());
      return rtnlist;
    }

  }

  List<double> FormatParamString(string input)
  {
    var rtnlist = new List<double>();


    input = input.Replace("<", "");
    input = input.Replace(">", "");
    input = input.Replace('m', '-');
    input = input.Replace('_', '.');
    string[] splitstring = input.Split('c');
    foreach(string str in splitstring)
    {
      try
      {
        rtnlist.Add(Convert.ToDouble(str));
      }
      catch
      {
        rtnlist.Add(0);
      }
    }
    return rtnlist;
  }

  /// <summary>
  /// Get name and value of analysis from an SBA string
  /// </summary>
  /// <param name="input"></param>
  /// <param name="name"></param>
  /// <param name="val"></param>
  /// <returns></returns>
  void FormatModelLine(string input, out string name, out double val)
  {
    int firstopen = input.IndexOf('<');
    int firstclose = input.IndexOf('>');
    int lastopen = input.LastIndexOf('<');

    name = input.Substring(firstopen + 1, firstclose - firstopen - 1);
    val = Convert.ToDouble(input.Substring(firstclose + 1, lastopen - firstclose - 1));
  }


  /// <summary>
  /// Get analysis types from list of models
  /// </summary>
  /// <param name="models"></param>
  /// <returns></returns>
  List<string> CalcUniqueAnalyses(List<Model> models)
  {
    List<string> rtnlist = new List<string>();
    foreach (var model in models)
    {
      foreach (var result in model.Results)
      {
        bool found = false;
        foreach (var calc in rtnlist)
        {
          if(calc == result.Name) found = true;
        }
        if(!found) rtnlist.Add(result.Name);
      }
    }
    return rtnlist;
  }

C#: Convert all images in a folder from PNG to JPG

How to convert all images in a folder from PNG to JPG.

This method is written in C#. Input a folder path. The code will then find all files with .png file extensions in that folder, and save them again as .jpg files. Original files will not be deleted.

The Image.Save method allows for a wide range of image formats including bmp, tiff and gif. You can edit the code below for your own file formats.

C# method to convert images to JPG

        /// <summary>
        /// Converts all images in a folder to JPG
        /// </summary>
        /// <param name="folder">String representing folder location</param>
        public void ToJPG(string folder)
        {

            foreach (string file in System.IO.Directory.GetFiles(folder))
            {
                string extension = System.IO.Path.GetExtension(file);
                if (extension == ".png")
                {
                    string name = System.IO.Path.GetFileNameWithoutExtension(file);
                    string path = System.IO.Path.GetDirectoryName(file);
                    Image png = Image.FromFile(file);
                    png.Save(path + @"/" + name + ".jpg", System.Drawing.Imaging.ImageFormat.Jpeg);
                    png.Dispose();
                }
            }
        }

Grasshopper: Calculate the Pareto front in multi-objective data in C#

A method for returning a collection of Pareto-optimal data. Pareto analysis is used in multi-objective optimisation to search for potential non-dominated solutions, i.e. solutions for which there are no solutions that perform better in every objective being assessed.

pareto-front

Input a collection of data. This data is accepted as Grasshopper’s DataTree format. The ‘tree’ contains a collection of branches. Each branch contains a list. Each list corresponds to the list of objective results corresponding to a single node.

The method sorts the input data into two DataTrees: Pareto-optimal branches and non-Pareto-optimal branches.

The algorithm is simple and unsophisticated, running in O(n2). It is fine for smaller data sets, though you may wish to investigate more sophisticated algorithms for larger datasets.

C# code to find the Pareto front

  private void RunScript(DataTree<double> data, ref object opt, ref object nonopt)
  {

    DataTree<double> optimal = new DataTree<double>();
    DataTree<double> nonoptimal = new DataTree<double>();

    //data should be a tree, where each branch is equivalent to one data point, and the length of the list is equal to the number of parameters.
    for(int n = 0; n < data.BranchCount; n++) //for each node
    {
      //check it against every other node
      //we need to find one node where every parameter is superior. if not, we have pareto optimality
      bool superiornodefound = false;
      for (int i = 0; i < data.BranchCount; i++) //check node i
      {
        bool issuperior = true;
        for(int p = 0; p < data.Branch(0).Count; p++)
        {
          if(data.Branch(i)[p] > data.Branch(n)[p])
          {
            issuperior = false;
            break;
          }
        }
        if(issuperior && i != n) superiornodefound = true;
      }
      if(superiornodefound) nonoptimal.AddRange(data.Branch(n), new GH_Path(nonoptimal.BranchCount));
      else optimal.AddRange(data.Branch(n), new GH_Path(optimal.BranchCount));
    }

    //return outputs
    opt = optimal;
    nonopt = nonoptimal;

    //grasshopper-related UI
    double optimalratio = Math.Round(100.0 * optimal.BranchCount / data.BranchCount, 1);
    Component.Message = optimalratio.ToString() + "% optimal";
    Component.Description = optimalratio.ToString() + "% of solutions are Pareto optimal.";

  }