Semi-structured interviews are a useful tool for gathering qualitative information. They provide more rigour than an entirely unstructured interview, allowing the interviewer to attempt to answer a number of predefined questions and allowing common themes between interviews to be established. They are more flexible and free-flowing than questionnaires or structured interviews, allowing interviewees to diverge from an interview plan when it might provide useful information that the interviewer hadn’t anticipated asking about.
Semi-structured interviews take time
Semi-structured interviews are time-consuming to perform. Each interview is performed manually, and is usually then transcribed, analysed and codified mostly by hand. Yet, if we are using semi-structured interviews to establish patterns across a population, we must have a sufficient sample size to give us confidence in any conclusions we arrive at.
So, we want a lot of interviews as this will reinforce our findings. But we want to minimise the number of interviews so we aren’t spending weeks or months gathering and analysing data. How do we decide where the sweet spot lies?
How do people choose the right number of interviews?
The answer to this is often based on gut feeling and experience, as well as the conditions within which the research is taking place (such as number of interviewees available, time available and so on). Guides rarely provide quantified guidance. Journal articles often fail to robustly justify the number of interviews that were performed, usually citing practical limits instead.
One approach that can be taken is that of reaching a point of ‘saturation’ (Glaser & Strauss, 1967). Saturation is the point at which, after a number of interviews has been performed, it is unlikely that performing further interviews will reveal new information that hasn’t already emerged in a previous interview. Optimising the number of interviews can therefore be thought of as seeking this saturation point.
It is surprising that, given the presence of a basic knowledge of statistics in most researchers in engineering, once a social sciences technique is used in an engineering paper, the use of rigorous mathematical techniques to underpin the statistical worthiness of a series of interviews seems to be forgotten about. This deficiency has been addressed in a recent paper from Galvin (2015).
A more robust approach
Galvin attempts to answer the question of how many interviews should be performed. He is critical on the use of experience and precedence, and instead uses a range of established statistical techniques to offer guidance to the reader.
He uses the assumption that outcomes are boolean. In semi-structured interviews, this normally manifests itself as whether a theme is or isn’t present in a particular interview. This kind of data usually produces outcomes structured like “7 of the 10 interviewees mentioned saving money on bills as important when choosing to insulate their home” for example.
Without sampling the entire population, we can never be truly certain that our sample is entirely representative. But as the sample size increases, we can become increasingly confident. If (and this is a big if!) our sample is randomly selected, we can use binomial logic to say how confident we are that the results from our sample are representative of the whole population.
Why we need to take a statistical approach
This all sounds very simple, but as Galvin found, it is quite remarkable how many recent published papers exist that attempt to draw out conclusions generalised across a large population derived from tiny sample sizes, without any attempt to show that a questionably small sample size can still be relied upon to deliver a conclusive answer. Small sample sizes are to be expected with semi-structured interviews, but the time-consuming nature of this technique isn’t by itself enough justification.
What we need is a way of justifying the number of interviews that are required for our study that is robust, and that allows conclusions to be drawn from results that are statistically significant.
An equation for the number of interviews
Of interest in Galvin’s paper is therefore an equation that calculates an ideal number of interviews, given a desired confidence interval and the expected probability that a theme. The ideal number of interviewees means one that ensures that a theme held by a certain proportion of the population will have been mentioned in at least one interview. This equation to calculate the minimum number of interviews is:

P is the required confidence interval, between 0 and 1. (Galvin took a value of 0.95 throughout the paper, indicating a confidence level of 95%.) R is probability that a theme will emerge in a particular interview (e.g. the likelihood that a particular interviewee will view cost as important when insulating a home).
So, for example, if we are after a confidence level of 95%, and we guess that 70% of people view cost as important in the entire population, then we would need to conduct 3 interviews to be 95% confident that this theme will have emerged in at least one of the interviews.
Of course, the statistical reliability of this method hinges on the accuracy of our guess for R. This is unlikely to stand up to scrutiny. What may be more useful instead is if we flip the equation, and say “given that I will conduct n interviews, themes that are held by at least R% of the population are P% likely to emerge”.
The equation for this is:

As an example, if we have conducted 10 interviews (n=10) and we will be happy with 95% confidence (P=0.95) then R=0.25, i.e. for 10 interviews, we are 95% confident that at least one person will have mentioned a theme held by at least 25% of the parent population. Or, in other words, if we run the experiment 100 times, each with a random subset of 10 interviewees, then in 95 of these, at least one person will mention a theme that is held by 25% of the parent population.
It is worth mentioning that the value of R is a function not only the proportion of the population who hold a particular theme, but also the interviewer’s skill in extracting this theme from the interviewee. While not a topic that will be dwelled upon here, this highlights the need for the interviewer to prepare and practise thoroughly to make best use of the interviews.
So, in conclusion, we have two equations which tell us in slightly different ways how many interviews we should do. If you can confidently give a lower bound estimate on R, then you can use the first equation to give the minimum number of interviews required. If you can’t estimate R, then you can use the second equation to suggest the maximum level of obscurity that a theme has amongst the population to still be exposed by your collection of interviews.
Can we estimate percentages from our interviews?
The above equation allows us to determine the minimum number of interviews to be reasonably sure that themes of interest will be mentioned in at least one interview. Once all interviews have been completed, we can expect to have a list of themes compiled from the different interviews.
Certainly, some themes will be mentioned by more than one interview. Taking the example above where 7 interviewees of 10 mention cost savings as being important, can we reasonably extrapolate this result to the whole population, and say that about 70% of the population therefore view cost savings as being important?
A basic knowledge of statistics will tell you it’s not as simple as this, and that there is a margin of error as you move from a sample to the entire population. Let’s say, after the first 10, you hypothetically carried on interviewing people until you had interviewed everybody. (In this case, this could be every homeowner in the UK!) You might have found, by the time you’d finished this gargantuan task, that in fact 18 million of 20 million homeowners thought saving money on bills was important – 90%. When you did your first 10, you were just unlucky in finding three people early on who didn’t care about bills enough to mention it.
When we take a sample, there is a probability that we will experience this ‘bad luck’ and find that our percentage from our sample is different from the percentage of the population at large. The likely difference between these percentages is the margin of error. If our sample is truly a random subset of the wider population, then we can make a statistical guess about how large this margin could be.
The trouble with small sample sizes, as is usually the case with semi-structured interviews, is that this margin is usually very large. The equation for this margin is:

Wilson’s score interval. Wilson (1904), Newcombe (1998)
p is the proportion of interviewees who mentioned a theme. z is the normal distribution z-value. If we continue using a 95% confidence interval, then z=1.96. n is the number of interviewees.
l1 and l2 are the lower and upper margins of error for p. What this equation tells us is that, if our interview tells us that p% of interviewees mention a theme, then we are 95% sure that, if we were to interview the entire population, that p would eventually converge to somewhere between l1 and l2.
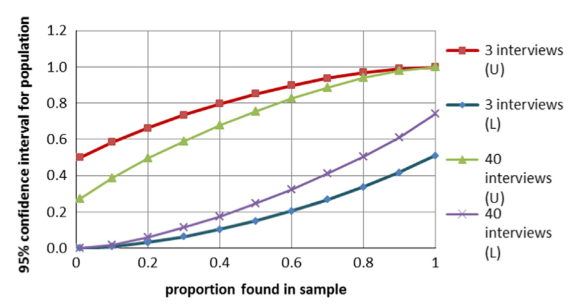
If we run these numbers on a typical semi-structured interview results, where n is usually small, then the difference between l1 and l2 is large. The graph below shows results for n=3 and n=40 for a range of values of p.
Source: Galvin (2015)
What is clear is that, typically, even for research plans with a fairly large number of interviews, the margin of error is going to be large. Too large, in fact, to be able to draw any meaningful quantified answers. If 16 of 40 interviewees (p=0.4) mention a theme, the proportion in the entire population could reasonably be anywhere between 19% and 67%.
So, the short answer is, no, you can’t usually quantify percentages from your interviews.
But in any case, this isn’t really what semi-structured interviews are for. These interviews will allow you to build a list of themes and opinions that are held by the population. Their nature allows these themes to emerge in a fluid manner in the interviews. If you are looking to quantify the occurrence of these themes, why not run a second round of surveys? Surveys are inherently rigid, but your semi-structured interviews have already allowed you to anticipate the kinds of responses people will be likely to give. And with surveys, you can issue and analyse many more, allowing you to raise that pesky n value.
References
If you found this article useful and would like to reference any information in it, then I recommend you read Galvin’s paper and pick out the information you wish to reference from there.
Galvin, R., 2015. How many interviews are enough? Do qualitative interviews in building energy consumption research produce reliable knowledge? Journal of Building Engineering, 1, pp.2–12.
Glaser, B., Strauss, A., 1967. The Discovery of Grounded Theory: Strategies for Qualitative Research, Aldine Publishing Company, New York.
Newcombe, R., 1998. Two-sided confidence intervals for the single proportion: comparison of seven methods, Stat. Med., 17, pp857–872.
Wilson, E., 1904. The Foundations of Mathematics, Bull. Am. Math. Soc. 11 (2) pp74–93.
Further reading
DiCicco-Bloom, B., Crabtree, B. F, 2006. The qualitative research interview. Medical Education, 40, pp.314-321.
