Spotify Mini: A desktop widget for Spotify

A desktop remote control for Spotify. Control Spotify from a convenient widget that sits at the bottom of your desktop.

SpotifyMini allows you to control Spotify from your desktop

With Spotify Mini, you can pause, play, change tracks, and view the current track, all without opening the main Spotify window. It is fully animated, and uses the 2010 Spotify skin.

This is a small project I made in 2010 using the Spotify-o-matic API wrapper to interact with Spotify. It is written in VB, and has largely been untouched since then. The source code is published at GitHub. Please note that this widget is entirely unaffiliated with Spotify itself.

Video via FlixGamez on Youtube

Dragging the title up (or clicking on the up button) for the context menu

Features

  • Play, pause and change tracks in Spotify from the desktop
  • Drag title to move into different positions on the desktop
  • Compact mode to hide the track title
  • Animated and skinned interface

Limitations

  • Assumes taskbar is positioned to the side or top of the desktop (as mine is…)
  • Ability to search and open the Spotify window is currently disabled (Spotify is now installed in the user directory, and I haven’t got round to properly updating it…)
  • Spotify should not be minimised (though it’s okay if it’s behind other windows)

Download

The source code is available here. If you just want to run it, click the link here:

Note that Windows may block the file for security. If you trust the file (i.e. if you trust me) and you are having problems, you may need to right-click on the file, go to properties, and click the ‘unblock’ button.

Credit to user yatiak on GitHub for bug fixes.

How to offset a curve in Grasshopper using the C# component

An example offset curve in Grasshopper
How to generate an offset curve in Grasshopper using only C#, either in the C# component or with Visual Studio:

NurbsCurve crv = new NurbsCurve(inputCurve.ToNurbsCurve()); //input curve to use as offset base
Point3d origin = new Point3d(0, 0, 0);
Vector3d vectxy = new Vector3d(0, 0, 1);
Plane xy = new Plane(origin, vectxy);
Curve[] crv4 = crv.Offset(xy, 1, 0.01, 0); //Get the offset curve array
NurbsCurve[] crv3 = new NurbsCurve[crv4.Count()]; //Make a new array with the size of crv4.count
for (int x = 0; x < crv4.Count(); x++)
{
    //Loop through the Curve[]
    crv3[x] = new NurbsCurve(crv4[x].ToNurbsCurve()); //Convert each Curve into a NurbyCurvey
}

Note that the offset function returns as a Curve[], and that the ToNurbsCurve() method can’t be used directly with arrays. The above code attempts to get around these limitations.

The mesh data structure in Grasshopper

Understanding meshes in Grasshopper can be a little tricky. They have a somewhat unintuitive data structure that can make it hard to handle meshes in C# code.

You probably already know a little about meshes. They are a form of geometry that contain a collection of faces, and that each face can have no more than 4 corners. How does Grasshopper handle this?

The basics

A mesh is a collection of faces. Each face is defied by 3 or 4 vertices. A vertex is a 3D point. A single mesh can contain as many faces and vertices as you want.

A mesh sphere in Grasshopper, indicating mesh points (vertices) and mesh faces


In terms of data structures, a mesh contains 2 lists:

  • A list of faces
  • A list of vertices

Firstly, we define a list of vertices. This is a list of 3D points. For each point, we can also imagine an index. For example, the fourth point in the list has an index of 4.

Then, we define each face. For each face, we define three vertices for triangles called A, B and C, or four vertices for quads, A, B, C and D. In the face list, the vertices contain the indices for the vertices, and not the coordinates of the vertices themselves. This is important to remember!

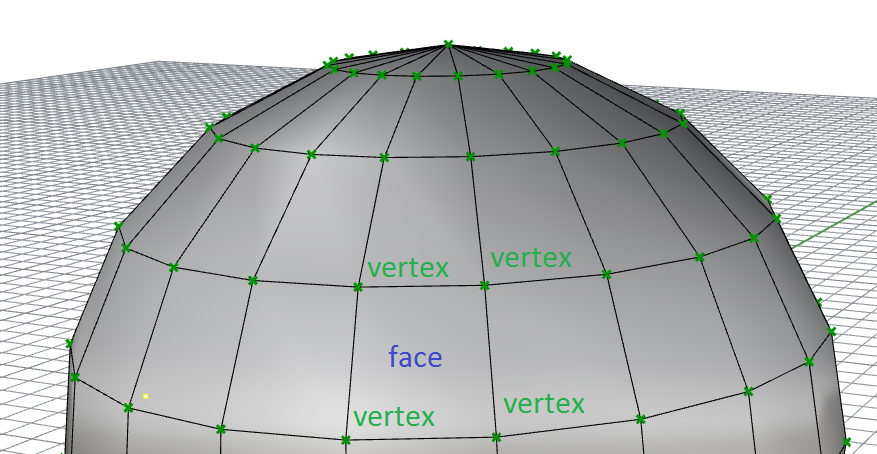
What does this mean when Rhino reads this data and tries to display a mesh? Take the example in the image below.

A table with an example showing how mesh faces and mesh vertices are held in the mesh data structure

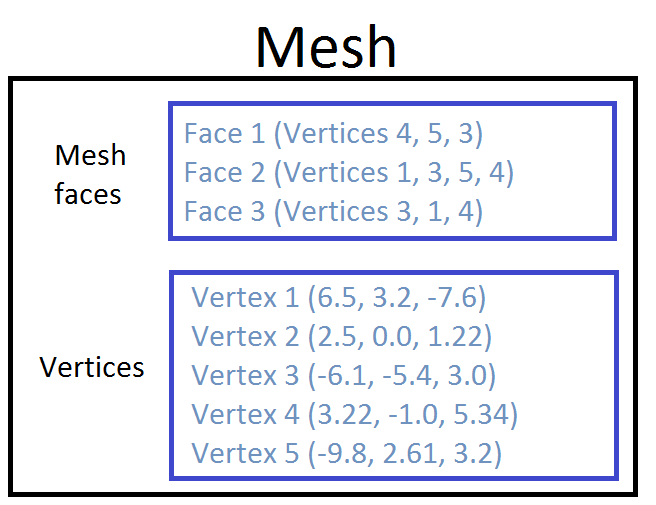
The mesh contains 3 faces. For the first face, we have three values and therefore three vertices, so face 1 is a triangle. What are the coordinates of these three vertices? To do this, we need to also look at the vertices list. Face 1 contains vertices 4, 5 and 3. Remember, these are the indices for our vertices. We take these three values and cross-reference them with the vertex list – reading the coordinates for vertices 3, 5 and 4.

Why is it so complicated?

The above system actually makes sense from a data efficiency point of view. Of course, in most meshes, multiple faces will share vertices. With the sphere above, each vertex is shared between 4 neighbouring faces. With the above data structure, we only need to define our mesh points once.

Furthermore, if we want to move a point on our sphere, we just have to update our vertex list. We don’t have to search for every copy of a node or worry about ‘breaking’ our mesh when we move mesh points about.

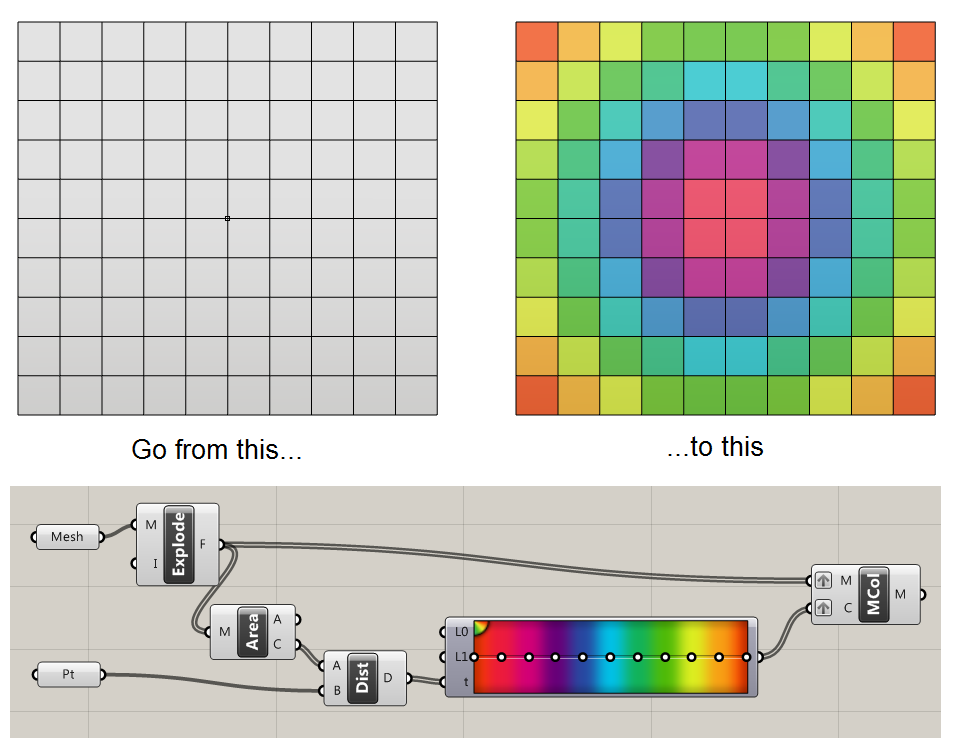
Manipulating meshes: A C# example

Create a C# component in Grasshopper. Create an input called ‘mesh’ and set its data type to Mesh.

  private void RunScript(Mesh mesh, ref object A)
  {
    //1) Let's read from an existing mesh

    //get faces from mesh
    List faces = new List();
    foreach(MeshFace face in mesh.Faces)
    {
      faces.Add(face);
    }

    //get vertices from mesh
    List vertices = new List();
    foreach(Point3d vertex in mesh.Vertices)
    {
      vertices.Add(vertex);
    }

    //2) Let's get the coordinates for a mesh face
    
    //get the indices for the 10th face
    int[] indices = new int[4];
    indices[0] = mesh.Faces[10].A;
    indices[1] = mesh.Faces[10].B;
    indices[2] = mesh.Faces[10].C;
    indices[3] = mesh.Faces[10].D;

    //We can now get the coordinates for the 10th face from these indices
    Point3d[] facepts = new Point3d[4];
    for (int i = 0; i < 4; i++)
    {
      facepts[i] = mesh.Vertices[indices[i]];
    }


    //3) Let's make a new mesh from scratch
    
    Mesh rtnmesh = new Mesh();
    //for the new mesh, we first need to define the vertices
    //we can add any points we like - let's just copy over the vertices list
    rtnmesh.Vertices.AddVertices(vertices);
    //now let's make a face and add it to the (currently empty) face list
    MeshFace tempface = new MeshFace(0, 1, 12, 11);
    rtnmesh.Faces.AddFace(tempface);

  }

Download an example

The code above is available in the file below.

Download

How to automatically get the measurement units in Grasshopper/Rhino

How to automatically find out if your Rhino document is set to millimetres or metres:

private void RunScript(ref object scale)
  {
    int rtnval = 1;
    Rhino.RhinoDoc  doc = Rhino.RhinoDoc.ActiveDoc;
    Rhino.UnitSystem  system = doc.ModelUnitSystem;
    if(system.ToString() == "Meters") rtnval = 1;
    else rtnval = 1000;
    scale = rtnval;
  }

This script returns a value of 1 if the document is in metres, or 1000 otherwise. (I assume that the user will only be using mm or m.)

To use, create a C# component in Grasshopper and copy the part between the curly brackets to the code of the C# component. Make sure that the component has an output called ‘scale’.

mm or m component

…or download the component from below:

Download

How to colour a mesh in Grasshopper

Let’s say that you have a mesh and a point. You want to colour the mesh according to how far the different parts of the mesh are from the point.

To do this, we need to:

  1. Import the mesh and the point into Grasshopper
  2. Calculate the distance between the different points on the mesh
  3. Apply these colours to the mesh

Colour a mesh with smooth gradients

Colour a mesh in Grasshopper - smooth


Colour a mesh with one colour per face

Colour a mesh in Grasshopper - discrete

Note that here I am using the ‘Mesh Explode’ component to break a mesh into its faces, which is part of the MeshEdit plugin for Grasshopper.

I also have grafted both inputs to ‘Mesh Colour’ – don’t forget to do this! You should quickly see why if you don’t…

If you don’t want to use MeshEdit, you can recreate the behaviour using the slightly more clunky method below:

Colour a mesh with one colour per face - Grasshopper

Finally, if you are writing script, it is also possible to colour a mesh using the C# component. See this post for more information.

Creating a relaxed grid on a mesh dome roof with Rhino/Grasshopper and SmartForm

Something I’ve found in my archives – one of the first projects I did when starting my EngD in 2013. We had received a domed roof from the architect, and we had been asked to optimise the form and experiment with different gridding options.

The problem was that the model we received was nothing more than a collection of lines arranged into one grid pattern and lots of little mesh faces between these lines – no NURBS surfaces or anything else nice to work with! The challenge was therefore threefold: recreate the NURBS surface, manipulate the surface into a structurally more efficient form (think lots of non-zero Gaussian curvature) and then apply a range of grids to it.

In hindsight, the methodology presented below certainly isn’t the most efficient or effective, but the important thing (as is usually the case in engineering) is that it got the job done!

Continue reading Creating a relaxed grid on a mesh dome roof with Rhino/Grasshopper and SmartForm

How to install Honeybee for Grasshopper

Honeybee is a plugin for Grasshopper for daylight analysis, created by Mostapha Sadeghipour Roudsari. Honeybee links to third party analysis tools in order to do its calculations. So in order to install Honeybee, we also need to install these tools. This can be a little fiddly – this guide shows how I got round it. Continue reading How to install Honeybee for Grasshopper

Conference report: COLEB 2014

ETH Zurich

What is COLEB?

COLEB (Computational Optimisation of Low Energy Buildings) is a 2-day workshop and conference held at ETH in Zurich on 6-7 March 2014. The various topics focused on the development and application of computational methods and algorithms into improving various aspects of building design. Some specific areas included:

  • Design optimisation (Using algorithms to improve aspects of building design)
  • Control optimisation (Such as improving the scheduling algorithms of HVAC)
  • Distributed energy systems (Including managing the issues with storage, load management and unplanned outages)

The event was co-organised and ran by Dr. Ralph Evins, a graduate of the Systems Centre and my EngD predecessor at Buro Happold. It was kindly sponsored by the Chair of Building Physics at ETH Zurich and the Swiss Competence Centre – Energy and Mobility Project “Integration of Decentralized Energy Adaptive Systems for cities”.

This is the first iteration of COLEB, and unfortunately it was never intended to be repeated exactly in its current form. However, there is talk of another COLEB workshop possibly being organised in the future. Watch this space!

Why did I go?

I have already attended a conference – FutureBuild at the University of Bath – but did not present – it was far too early in my research, and in any case the theme seemed too far removed from my own work. But COLEB – with its intention of looking at the latest modelling and optimisation methods as applied to efficient building design – seemed perfect for me as a place to give my first presentation.

Your first conference presentation?? What was it like?

In form true to myself, the presentation was only finished mere days before the workshop, and I was still writing my speech for it in the airport. Practising in the mirror in the hotel the night before, I finally had it nailed.

But actually getting up to do the presentation in front of around 30 people, I introduced myself, got on to the first slide, and immediately forgot every word! So, instead of my careful plan, I just started talking. It was roughly in line with my speech but certainly not what I’d rehearsed. In the end, it was a very free-form speech and it was, I think, quite successful, and even though I didn’t stick to my planned speech, the practice was still essential for me being relatively comfortable with it.

How was the rest of it?

As the only participant with a primarily industrial focus to my research, I did hold somewhat of a special position in the conference. There were some very interesting ideas all round, though there was always a voice in the back of my mind judging each speech on the practical and commercial viability, something I think to some extent sets industrial and academic minds apart. But this blue-sky approach is perhaps something we need to be more confident of embracing in industry – we can be too quick to dismiss an idea if we can’t foresee a safe return.
One key benefit of going to conferences is the opportunity to network. COLEB was formed partially as a result of the community of those who attend the likes of the BSO conferences, and there was interest among a number of the participants in creating and attending a second COLEB next year. Specifically with regards to individuals, business cards were exchanged and I have made a number of follow-up commitments with participants, which hopefully may turn into something very interesting.

Seems interesting! Where can I learn more?

You can visit the website here. The website includes copies of my presentation and paper, as well as for the other attendees. You can also contact me directly if you have any questions 🙂

How to read Excel files with Grasshopper

A quick guide to reading Excel files into Grasshopper for Rhino.

1) Install the LunchBox plugin for Grasshopper

2) Open the Excel file you want to read, and minimise it to the taskbar.

3) In Grasshopper, find the component called Excel Reader. Add your worksheet, column and row values in numerical format. Set ‘read’ to true.

Hints and tips

  • The component is clever – you don’t need to ‘link’ the Excel file to GH – it just looks for anything you have open. This is apparently more computationally efficient.
  • If you want to read multiple columns at once, enter multiple columns using the ‘series’ component. The output is a data tree instead of a list.

  • Always use numbers to describe columns (A=1, B=2…) and worksheets (Sheet1 = 1, Sheet2 = 2…).