The UTCI is one of the more popular ways of estimating the perceived levels of thermal comfort in a space. In this previous post, I published some C# code that allows you to calculate the UTCI.
This code accepts inputs of air temperature, mean radiant temperature, humidity and wind velocity, and returns an equivalent perceived temperature in degC.
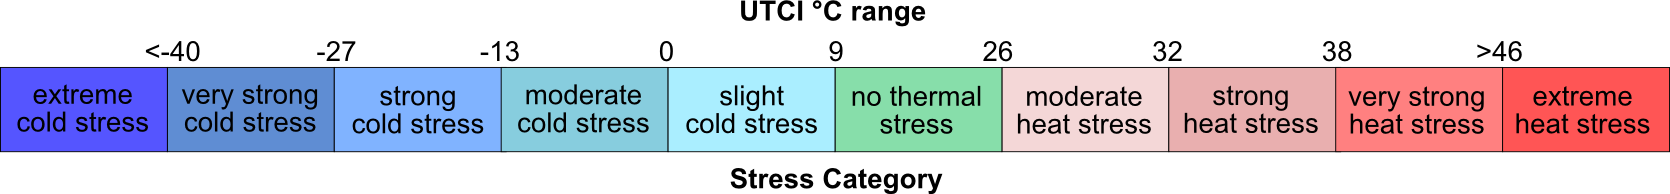
According to the original author here, it is only valid for certain input ranges, namely:
- Air speed must be betwee 0.5 and 17m/s
- MRT must be no less than 30C and no more than 70C of the air temperature
- Air temperature must be between -50C and +50C
I have been using this UTCI code quite a lot, assuming that the model was a suitable approximation if I kept within the specified input ranges.
However, this is not always the case. While the algorithm seems to return suitable results when well within these ranges, when I started to approach the limits of these ranges (though still inside them) I noticed it is possible to generate some rather… interesting results.
Setting up a test
To test, I built a very quick document in Grasshopper. I created a graph, showing the UTCI value on the y-axis and the full range of humidity (0 to 100%) on the x-axis.
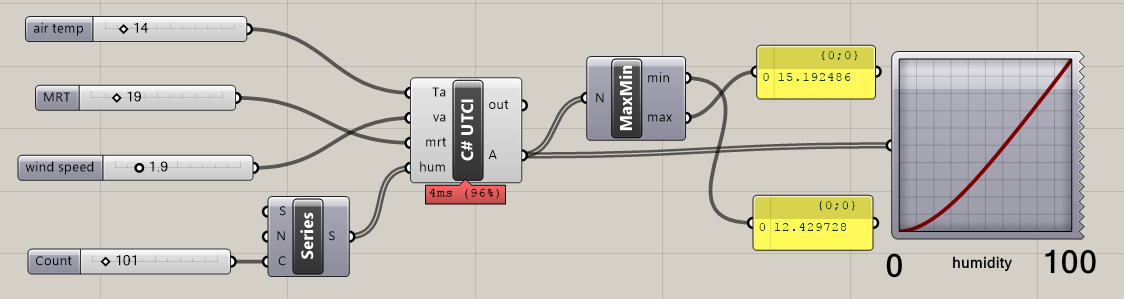
This seems very reasonable. A cool day, with a little warmth from the sun and a gentle breeze. The perceived temperature increases with humidity, and within a sensible range of UTCI output. Exactly what we’d expect.
Where it sometimes goes wrong
Firstly, let me say, with all sensible combinations of inputs that we’d expect to find in the real world and in our work, the UTCI returns a sensible output.
However, it is not difficult to find other combinations of inputs where the graph is a surprising shape and is clearly not right. Note that in my examples below, the inputs are still within the specified limits of the UTCI model.
Here, we can take exactly the same example, but turn up the air temperature. Look at the result when the humidity is also high.
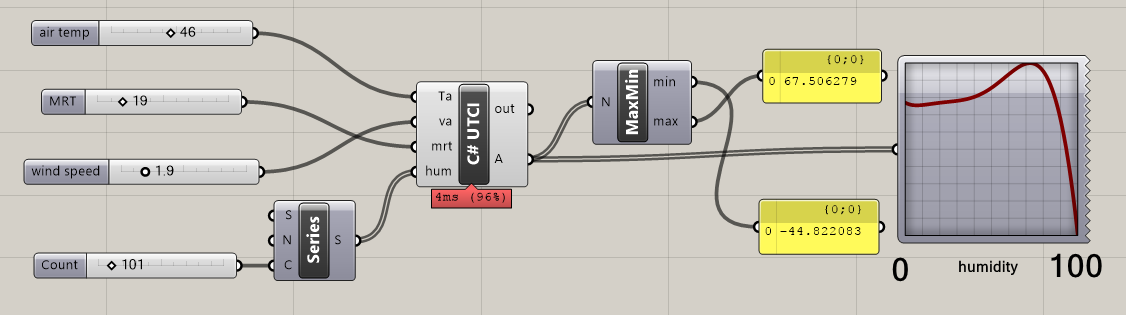
The UTCI algorithm returns a temperature of -44C at 100% humidity – clearly not right.
Now let’s reverse the extreme values of air temperature and MRT.

While the result seems correct at the high end of humidity, there is a strange dip at the lower end. This isn’t so bad though, since the range of predicted UTCI values is very small (between 34.7C and 35.8C).
My advice
In most cases where values are far from the prescribed limits, the UTCI seems to return a reasonable value. In particular, it seems sensitive to extreme values of air temperature and MRT.
Particular cases seem to include when the air temperature is high (above about 40C) and when the MRT is much below the air temperature (approaching the 30C difference limit).
This isn’t conclusive, but it is more a warning to take care if your inputs are approaching the limits that the predicted UTCI could be erroneous in such cases. Most of the time, this is unlikely to affect you. But, if you are designing something like a cooling system in a hot, arab climate, or are attempting to estimate the UTCI in front of a radiant heat source, it is possible that the result might not make sense.
In particular, take care if you are implementing the UTCI in a computer program, since the computer will return an incorrect result quite happily.